Go back to RESOURCES
SarcLen & FFTs:
Applying a Fast Fourier Transform to Sarcomere Length Measurements

SarcLen Image and Intensity Windows
Some questions have been raised with regard to the blue line accompanying the raw line intensity in the SarcLen acquisition module. The following tech note provides some background of the FFT and an explanation of the blue line.
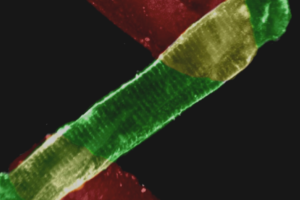
IonWizard’s SarcLen acquisition module provides a real-time measure of the sarcomere length. The high contrast and regular spacing of sarcomere Z-lines provide an ideal set of circumstances to apply a fast Fourier transform, or FFT. In practice, the video image of an isolated striated myocyte shows a clearly repeating contrast pattern resembling a sine wave. The Fourier analysis computes the frequency of this waveform. The result of the FFT calculation, the “power spectrum”, is displayed in red along with the intensity traces beneath the video window. The power spectrum should appear as a line with several small peaks and a major peak. The predominant frequency corresponds to the distance from sarcomere Z-line to Z-line within the selected ROI.
The raw video intensity is multiplied by a cosine function to reduce the contrast intensity near the edges of the ROI. This is known as a smoothing window. The FFT is based on the windowed data (blue) rather than the raw line intensity (black). Some explanation of why and how windowing is performed is necessary:
- An FFT attempts to describe a spectrum or sinusoid with regular periodicity and symmetry. The FFT requires an infinite data set; so the data has to be virtually repeated. The FFT generates artifacts when there are boundary discontinuities where the amplitudes at the boundaries do not meet. Boundary discontinuities result in sharp transitions when the data is repeated (something called “spectral leakage”) and this amounts to a whole lot of noise and artifact. It also fails miserably when there are sharp transitions (impulses, steps, or square waves) in the data itself. Sharp transitions have nearly infinite frequency components and cannot be accurately represented by sinusoids.
- Smoothing windows are used to avoid both sharp transitions from discontinuities and actual data (like the one that you might see if the cell framing aperture is within the ROI). There is no way to run an FFT on the data without minimizing the data at the boundaries. There are many different types of smoothing windows. SarcLen employs a Hamming window. It is a slight variation of a Hanning window and is the recommended smoothing window for general applications where sine waves are closely spaced. The Hamming filter is the convention for this type of application, but the reality is that all filters treat the data in a nearly identical manner. They all bring the data to zero (or nearly so) to eliminate boundary discontinuities; they all favor the data represented by the information centermost in the windowed region.
- The FFT is based on information throughout the windowed data; even as it approaches the baseline. The relative contributions may not be great near baseline, but they’re still there. Because the smoothing window favors the sarcomeres that are centermost within the ROI, care should be taken to position the ROI appropriately.
- The raw (black) and windowed (blue) lines are treated independently; the FFT is only applied to the windowed data. The windowed data is a function of the raw line and is scaled as a % of the raw line, but the windowed line should only be considered as relative to itself when considering the weight that the data contributes to the Fourier analysis.
- Extending the ROI too much to bring even more sarcomeres into the center of the windowed data could move high contrast boundaries into the windowed region. This will appear as a step and will create the sharp transition noise artifacts mentioned above; this negates the effect of the smoothing window and should be avoided.
- Fourier transforms are performed more commonly on time and frequency. We are running the FFT on spatial information at distinct points in time; that is, “time” and “frequency” are pixels and 1/pixels with respect to SarcLen. The resulting power spectrum (1/pixel) is then inverted and multiplied by the calibration factor (units/pixel) to yield microns.
As an aside, the large peak at the left-most (or lowest frequency/ greatest period) portion of the power spectrum is the offset. Within any cell there are elements that contribute contrast. The FFT analysis will attempt to represent these as part of a repeating sinusoid. They will typically have a low frequency relative to the sarcomere frequency. These artifacts are easily ignored by positioning thresholds to exclude them. The power spectrum display is auto-scaled based on the green vertical max and min thresholds. In other words, the power spectrum is scaled according to the largest peak between the green lines. When interpreting the power spectrum, it’s important to note that the y-axis values are relative and, therefore, without units. The x-axis values, while not explicitly displayed, correspond to the frequency of the function. The inverse of the frequency is the distance. Moving from left to right on the x-axis corresponds to an increasing frequency and a decrease in periodicity; the periodicity in our case is the sarcomere length. As the myocyte contracts, the predominant peak shifts from left to right.


